Welcome to the ICON Infographics Series
The principal aims of our infographic series are:
- To share our research findings in a way that is more accessible and translatable than our academic outputs
- To share our research findings in a visual format that is appealing and conveys the main messages of our results and, in some cases, how the research was conducted
- To create visual representations of our academic outputs that can be interpreted by others in meaningful ways to spark conversations or engage individuals or groups
- To communicate our research methods and outputs with relevant stakeholders such as clinicians, public health professionals, other researchers, cancer patients and policy makers
- To expand and improve communication of our research with the general public
These infographics are developed through a collaborative process between ICON researchers, non-academic staff and external stakeholders. In particular we would like to acknowledge the contributions of Adrian Turculet, Yuki Alencar and our brilliant Patient and Public Representatives.
We hope you will find these interesting and welcome any feedback. This page will be updated as further research is published. Please click on the headings below to access the infographic.
- Differences in colon cancer survival for patients living and receiving care in London
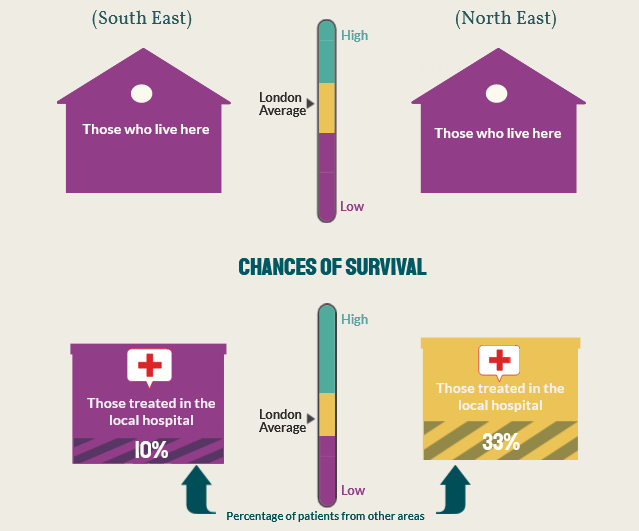 This study highlights the need to better coordinate primary and secondary care sectors in some areas of London to improve timely access to specialised clinicians and diagnostic tests.
 - Risk score for pancreatic cancer
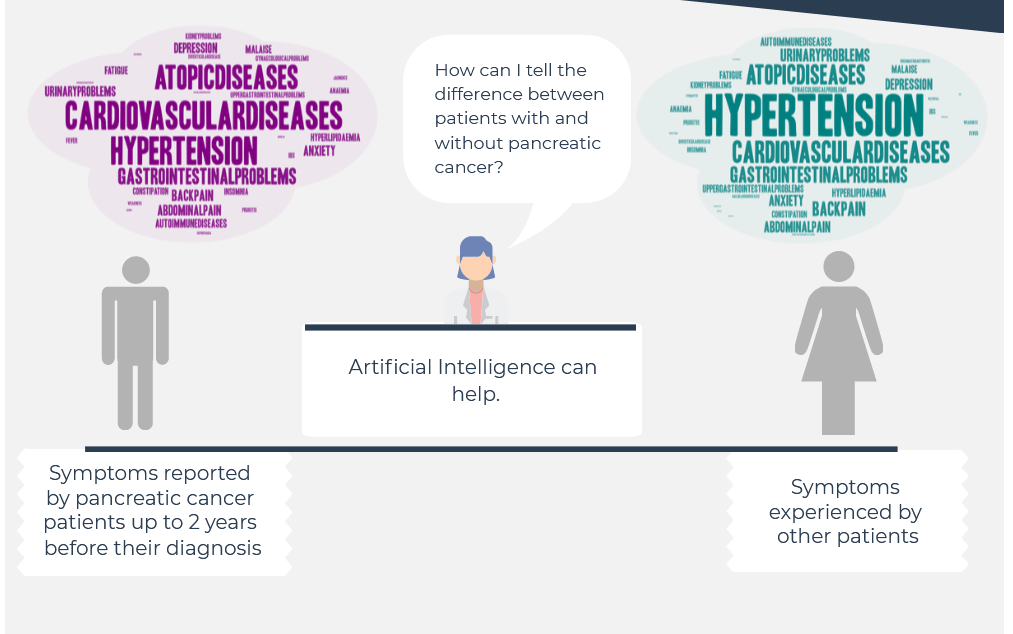 PANCREATIC CANCER PATIENTS are usually diagnosed too LATE for curative treatment because there are no early stage symptoms associated with tumour development.
 - Does the socio-economic level of my area represent my own individual circumstances
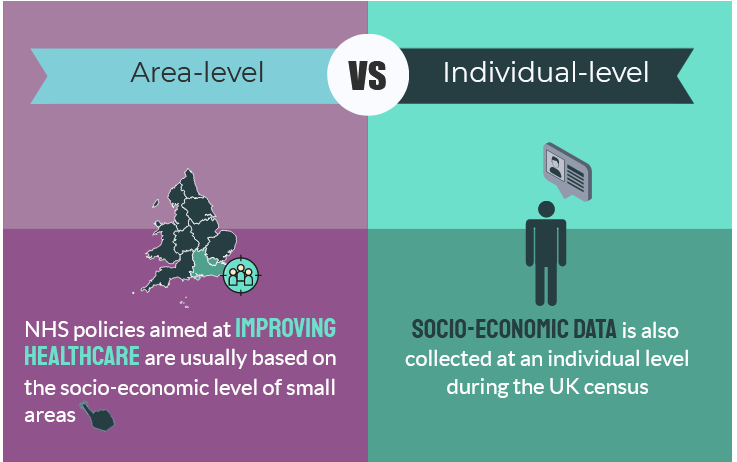 Assessment of the concordance between individual-level and area-level measures of socio-economic deprivation in a cancer patient cohort in England and Wales
 - The impact of the covid-19 pandemic on cancer deaths due to delays in diagnosis in England
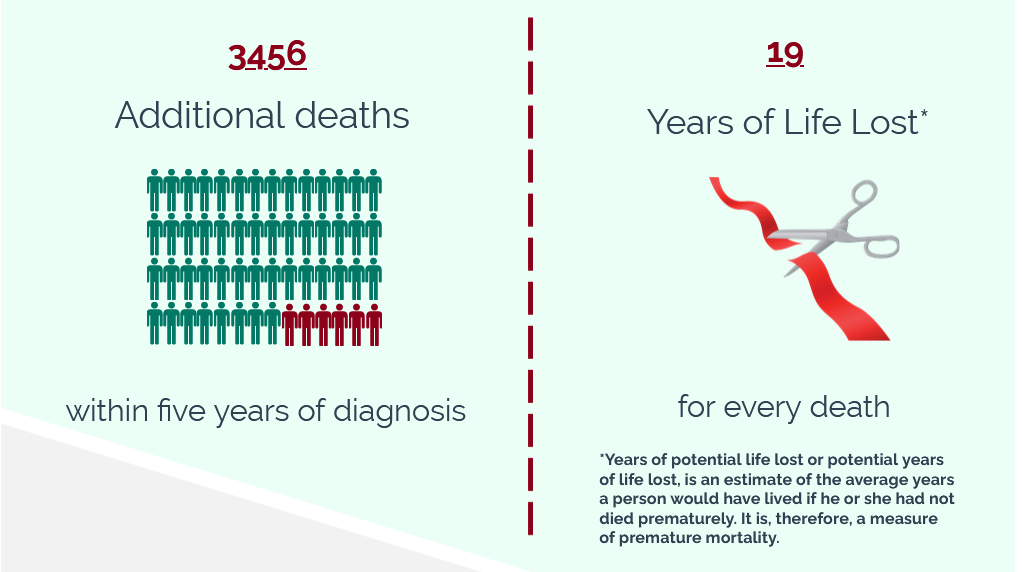 Since a national lockdown was introduced across the UK in March, 2020, in response to the COVID-19 pandemic, cancer screening has been suspended, routine diagnostic work deferred, and only urgent symptomatic cases prioritised for diagnostic intervention.